In this section, clicking on an image will usually enlarge it
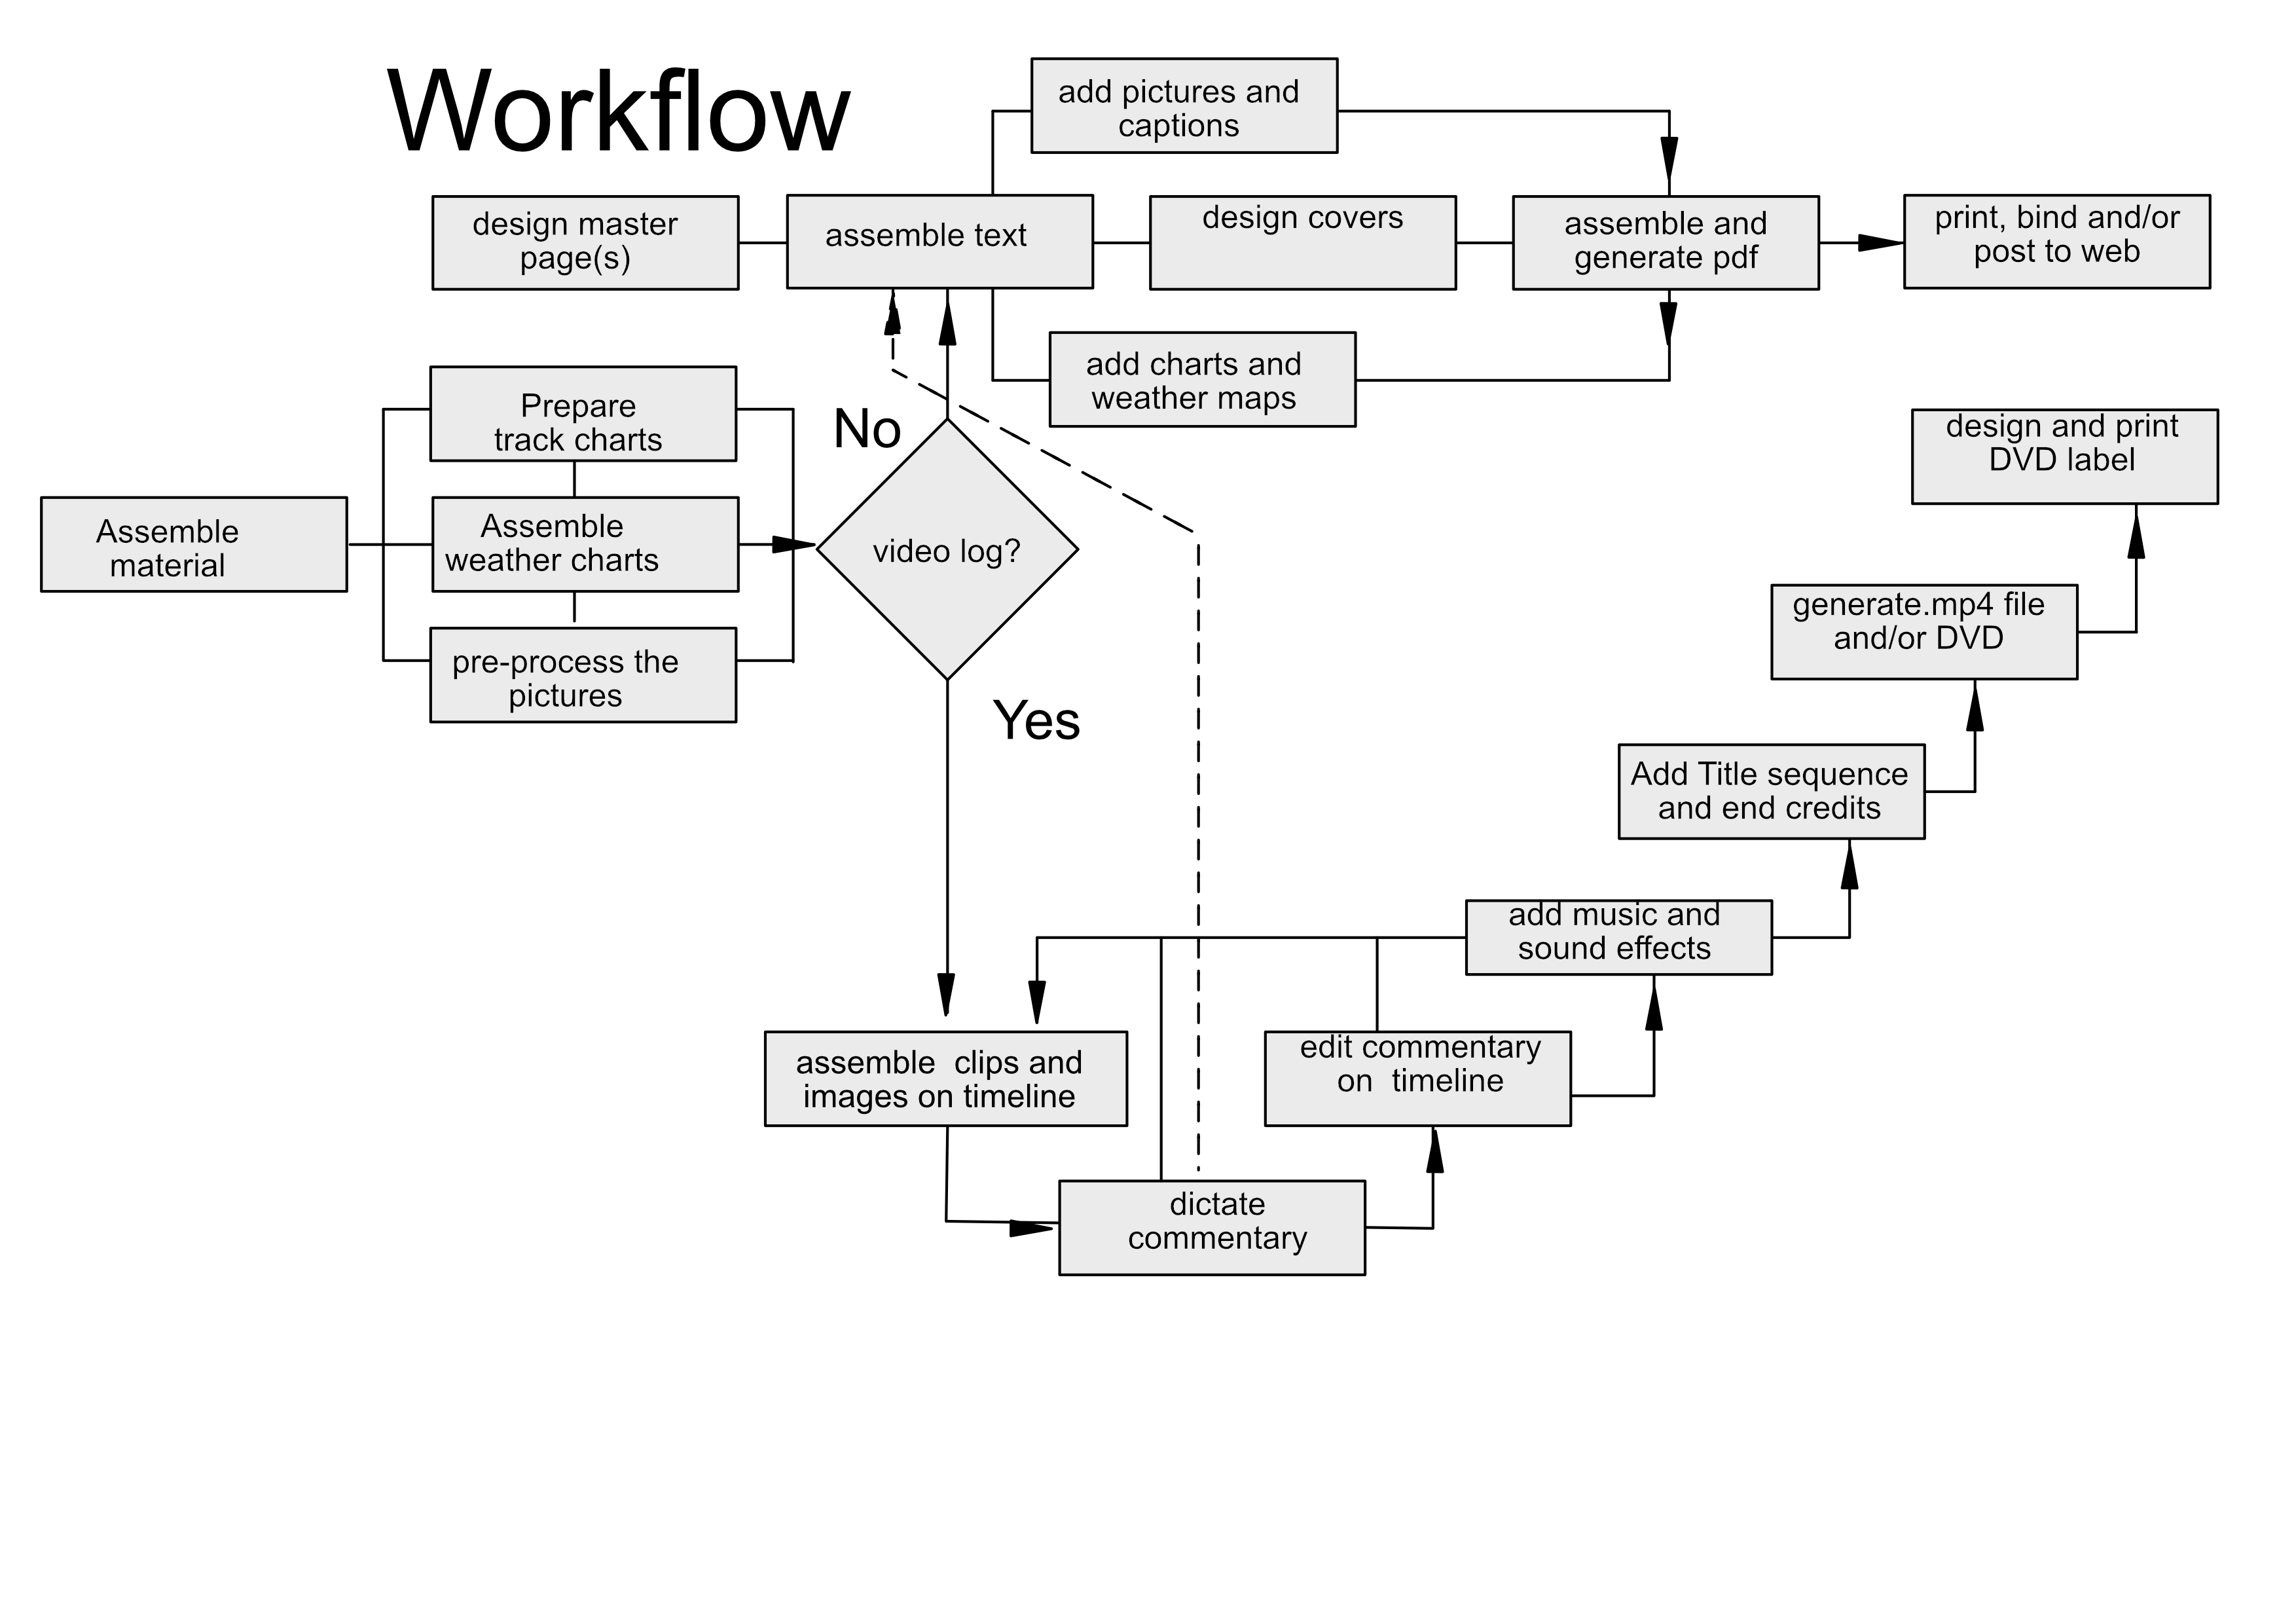
Click on the tabs below to access explanation and links to tutorials that explain the workflow (see diagram below)
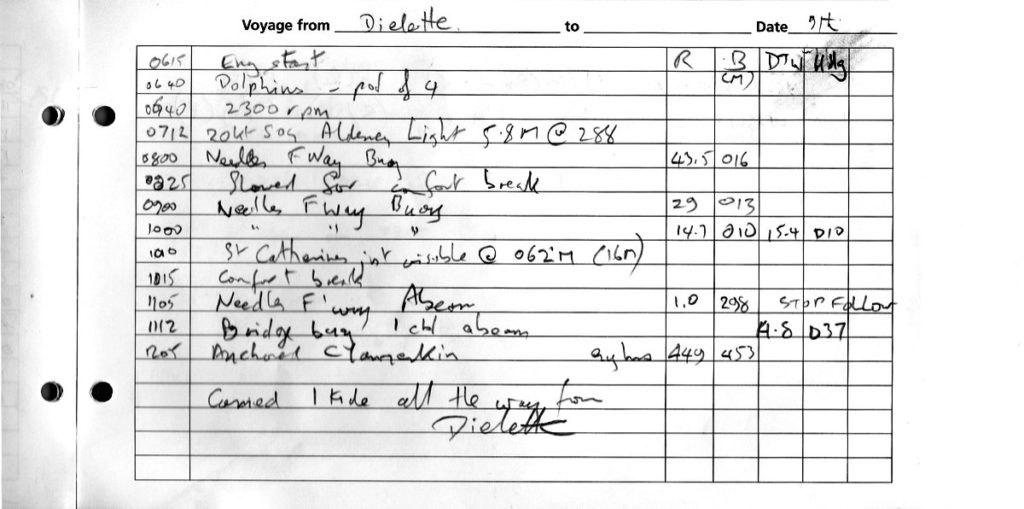
The deck Log is the essential note book that will guide you through the story of your voyage in the right sequence 6 months later when you get round to assembling the Log, and have forgotten the detail. There are many beautifully produced and complicated deck Log books, often given as Christmas presents that are frankly worse than useless. I like a very simple log book shown in the illustration above . It has a number of columns that do not have column headings (and so can be used flexibly) on the right hand side and a blank page on the left. It is contained within a tough cover and small enough so that, for most purposes, one page a day makes sense.
When thinking about the next day’s passage, I will start the Log page for that day and write down relevant tide times on the blank left page. (For the Solent these are usually Portsmouth and Cherbourg — because my tidal atlas is based on Cherbourg)
I try to start the Log each day on the right with a very brief description of the weather such as “cold and sunny” or ” raining hard, very windy, snatching at anchor”. Those words set the mood for the day. Additionally I like to take down the shipping forecast, if I am up early enough! This can be scribbled on the left hand blank page. Usually this means listening to the 0730 maritime safety information broadcast from coastguard. You have to learn how to take down the forecast at the speed that they read it. This means developing a form of shorthand. I was first introduced to this in the lovely weather books published by Alan Watts. For example, the forecast which reads ” Selsey Bill to Lyme Regis; east four or five becoming variable three or less then southwest 5 to 7 later, perhaps Gale eight later; slight or moderate but smooth in the west at first, occasionally rough later, occasional rain later, moderate or good, occasionally poor later” can be represented by

If you are in Ireland, forecasts go right round the coast in a clockwise direction, and also give weather conditions and wave height at certain weather buoys. Extremely useful, but you need to find a chart that shows where the weather buoys are and the headlands they use to define the areas. If you’re in France, you need to be able to understand the weather terms. I recommend purchasing Bloc Marine, an absolutely excellent bilingual almanac showing all the terms, and lots more information as well. More on other weather sources later.
I sometimes use the blank left hand page to note down interesting information heard on the VHF, for example the position of a casualty broadcasting a mayday
When we were sailing, we used to, religiously on the hour. log position course and speed. If using a way point, we would also record bearing and distance to way point (having first recorded the way point position). On a motor boat, the passages tend to be shorter in terms of time, so reporting can be a little less dense. Here is the close up of the deck log page above which I wrote when we crossed the Channel from Dielette to the Needles.
On passage I like the chart plotter set to the chart with an AIS overlay. This enables me to see any other shipping, and by simply placing the cursor on any point, I can get an accurate range and bearing. (This would enable me to plot the position if all electronics failed) So the first 2 columns are ‘R’ and ‘B’. I thought I might use Bearing and Distance to waypoint, so 2 more columns were marked for that.
This was the first time I had used the Logbook for a longer passage on a motorboat. Another time I might use the columns for “rpm”, “bearing” “Distance”, “Eng hours P”, “Eng hours S”. If using waypoints, different headings would be appropriate. That is why I like the flexibility of this Logbook layout. It is also useful to write down engine hours at the end of a passage, and any fuel purchased.
I’m very bad at writing down the things that we do in harbour. It sometimes makes it difficult for me to remember what we did or who we met and in what order. It is an interesting change of emphasis. In a sailing boat there is much more emphasis given to the passage, whereas on a motor boat it is what you do at the destination that is more important, and I have not yet got used to the change of emphasis. We also keep a visitors book. Immensely useful for recording names of boats and their crew that we have met on our cruises, especially when you meet them again 5 years later!
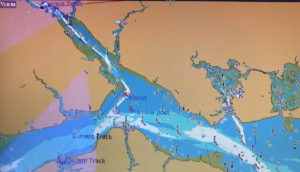
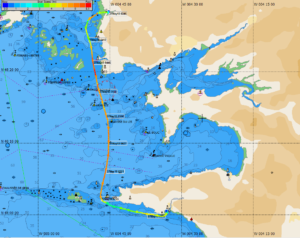
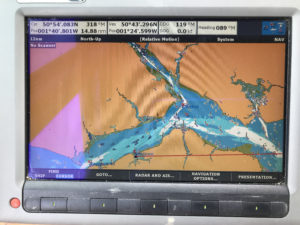
I have recently started to take a photo with my iPad of the track on the plotter at the end of each day. It is a useful adjunct to the Deck Log and can be used to aid drawing a track on a chart in your photo editor (see track charts)
So with the forecast (and other information) on the left, and what we did on the right, the framework for the Log has been constructed.
My early logs use photographs scanned from very small prints taken with a very basic camera. Time has moved on, and we now have the Internet, digital photography, and desktop publishing; as well as the ability to stitch photographs into panoramas and all kinds of other magical tricks. Yes I use all of these from time to time, but they are not strictly necessary. The best camera is the one you have with you at the time you need to take the picture. This might be your phone, your tablet, or a pocket camera, or a Nikon with a big zoom lens on it. I will say that I have seen very few photographs taken from a boat with a phone or a tablet that are sufficiently sharp to use unless printed very small. Some kind of proper camera seems to be the best choice (preferably with vibration reduction and autofocus), but provided it is digital, it does not matter too much which one.
Logs, especially videos, are voracious consumers of photographs. It does not matter how many you take, you will wish you had taken that extra one. With a digital camera, there is virtually no cost. For example on our 6 day trip to France I took about 150 images, i.e., about 25 per day.
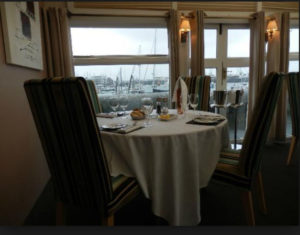
 Unless the primary purpose of your cruise is photography or making a video, there will be times when you forget, or do not want to use the camera (e.g. inside a yacht Club lounge, or some restaurants). One tip is to avoid using flash. I have a 35mm f1.4 lens on my Nikon that will take fairly good photos in artificial light that can be adjusted in post processing. It is amazing what a computer can find in a dingy looking photo. (How to plug any gaps still left will be covered in the Autumn article)
f you are in remote places such as the Hebrides or W Coast of Ireland, a camera mounted GPS may be helpful, though I confess I find I often cannot wait for it to acquire a fix. Another alternative is to take a photo of your chart plotter from time to time as this can help locate the photos taken before and after that.
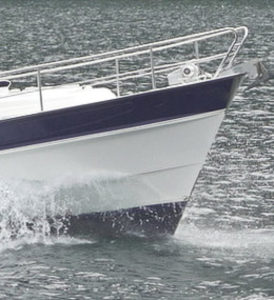
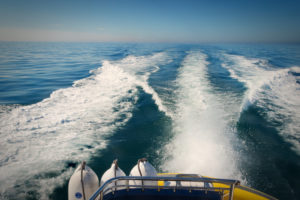
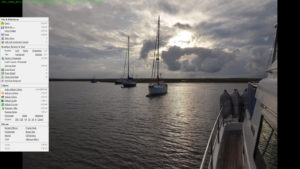
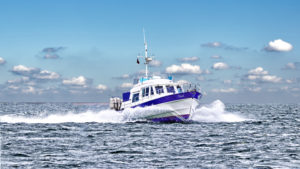
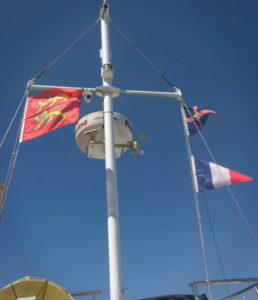
Some things you may not have thought of photographing could include your bow wave or wake, burgee and courtesy flags up the mast, town streets, the pub or restaurant that you used, the meal itself, shingle on the beach, interesting skies, brochures or interpretation boards of places you visited, flowers, markets, forts, buoys with the tide rushing past, reflections of skies in calm water (especially at dawn or dusk}, sunrises and sunsets, a foggy day on a mooring, a moonpath, other yachts or motor boats to illustrate the weather, lighthouses, headlands, marinas, beaches, dolphins (be quick!), birds. Above all take every opportunity to get pictures of your own boat (in a marina, at anchor (from the dinghy?), dried out, when launching), and get your friends to photograph you at sea. Good portraits of your own boat are like gold dust for a Log. [Fig 8 – my photo of Star Ruby] So be kind, and take photos of your friends as they sail past, and send them a copy.
Remember the photo can always be doctored and given a new background or sky.
Recently, now I have a large plotter screen, I have taken photos of AIS plots and AIS data screens. I have also shot pictures of the weather map on our portable television when I did not have internet access. All useful!
(As an aside, I think the next major development is going to be using dashcam and drone images, but we are not there yet, and I believe drone regulations have not yet settled down).
Which brings us neatly to video. In 2010, we were away in Biscay for nearly 4 months, and generated two 50 minute “videos”. They can be seen by clicking on these links
Ariadne 2010 cruise – Southbound
Ariadne 2010 cruise – Northbound
There is probably less than 10 minutes of actual video in total in each video. The rest is made up from animated charts, and still photos using various video effects and fades. To produce 100 minutes of all video would mean that you did nothing else during your holiday, which is not the purpose of the exercise. Tne problem is that the most interesting video is when you are manoeuvring, which is when you are so busy that taking video is not possible (though you may be able to snatch the odd still image). This is where I think the dashcam will come into its own in future. To get good video footage, I think you need to be in relatively open water, proceeding on autopilot. On the motorboat, I have shot video through the wheelhouse door, and from the flybridge. Both work, but, frankly, neither are that interesting. I am still experimenting! On the yacht I once hand held the video camera while hand steering on a very windy fast reach through the Tas de Pois near Camaret. The result was surprisingly good, but I have still to publish that moment on the Internet.
One problem of boating is that most breathtaking views are essentially panoramic. I will cover how to create panoramas in the autumn article, but in the meantime if you see a view that is really wide, try shooting the photos needed to stitch a good panorama. There are a few steps to look out for
Point you camera at the ground and take a picture. This will mark the start of you panorama sequence
Point your camera at the best part of the view, and if it is automatic let it set aperture and speed. Then change to manual mode (so you don’t get different exposures for each part of the image. If there is a horizon, use it to get your camera level
Start at one side of the view (let’s say the left) and take the first frame. Note some object about one third from the right and side.
Pan to the right until the object you noted just shows in the frame. Take the next shot, repeat the process till you reach the right of the view you want.
Point your camera to the ground and take a shot to mark the end of your panorama sequence
Note: You can take vertical panoramas too
The procedures for stitching the images into a panorama can be seen by selecting the Preparation tab on the left and selecting “Pre-Process Images”
One final point about photos. If I am producing a Log (Narrative text or video) for my own use, I will include quite a few photos of people. So it is often the case that the version published on the Internet has these edited out. I do not think it is safe or desirable to publish too many personal images on a broadcast medium, especially if you do not have the explicit consent of the ‘model’.
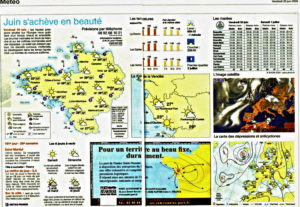
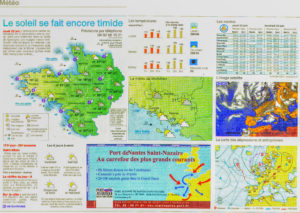 Having done all that, there could still be gaps. If you have been at a rally or an organised event, there may be an ‘official’ photo cd or arrangements for borrowing images taken by others. Local newspapers can be another fascinating source. In FranceI have relied on the Ouest FRance newspaper which has a wonderfuldouble oage spread about the weather. I keep the weather page for use when I get home. Not many are used, but headlines often make me smile!
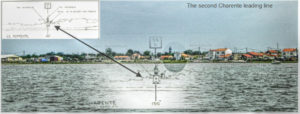 I also use images scanned from pilot books and tidal atlases. There are probably copyright issues, but, because I have never sought to make money from my Logs, I have not had a problem. [Fig 9] I particularly like Pilot book diagrammatics that can be compared with photographs which I took at the time.
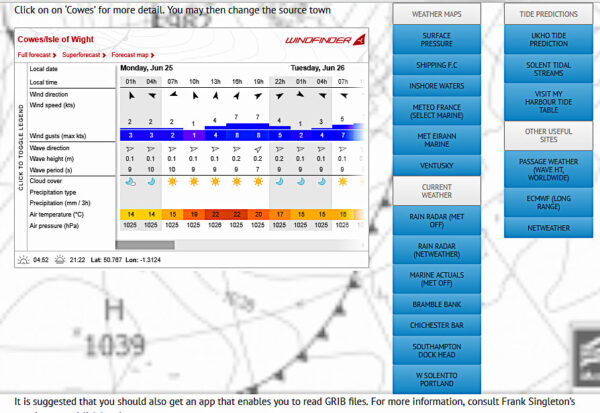
All our cruising takes place in the context of the weather. It can dictate where and when we go, and affect our mood. It therefore provides a wonderful background to a Log. Over the years I have put together a set of weather websites that I found useful sailing on the South Coast and the coasts of Ireland and France. They can all be accessed from my website by clicking here(see diagram above)
Apart from the useful overview, 4 days ahead, given by the Windfinder app, it is divided into these sections
(a ) Synoptic charts and official weather forecasts
(b) Current wind and wave conditions at useful places
(c) Tidal data
(d) Other useful sites
One problem with weather maps is that they are not easily available later. So you have to collect them as you go through the cruise. I would recommend extracting and saving at least one synoptic chart a week (i.e a chart that shows weather fronts). Indeed, before a longer passage (such as a Channel crossing), I tend to record weather maps for several days ahead. Then, if I wish, I can review in the Log the effect of the weather on my thinking at the time,
On the same page on my website there is an explanation of grib weather files and their value. One great advantage of saving a grib file is that it contains masses of data at a point in time. If you save that grib (and carefully note the date on which it was generated!) then you can decide much later – when you are writing up the Log – which presentation of the data suits your purpose.
To make use of Grib files you will need an app on your phone or computer. I use SailGrib Free on my phone and Zygrib (which is also free) on my laptop, There is more about this on my weather web page – go to the links below met office data]
This video is an example of how to use Zygrib files and extracting the information for use in Logs. It also covers the technique for copying and using any screen image for use in your Log. So you can copy any of the weather maps or forecasts shown on my weather site and save them for use in your Log later.
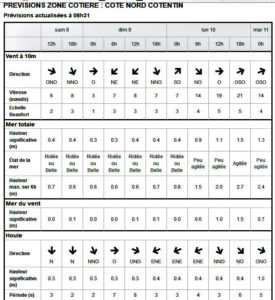 I would particularly commend the forecast published by Meteo France. Swell is a feature of the French Atlantic coast (and the French Channel coast too). They distinguish between the wind waves and the swell, which can have a different direction and height and produce nasty cross seas. Ireland is also better than UK at publishing wave data.
Wifi is now commonly available at marinas, and if there is mobile phone coverage, but no Internet, your phone can act as a modem to your laptop or just record the weather data direct. Most of us rely on the Internet, where weather data is prolific. For Log purposes, you need to be able to record what you can see on the screen. I take a laptop when I am away on a cruise, so I can do a screen grab and save the image which I name with date + source. If you are using a mobile or a tablet, you can save the image, then mail it to your home address, so it is there waiting for you when you get home. Be careful about including the date in the filename in the format yyyymmdd!
Other information from my weather web page covers the following
– Comment on other aspects of weather data including links to an explanation of GMDSS. It sounds boring, but it is important.
– Few boats are in remote places, so the need for weatherfax by SSB (single sideband radio) or satphone) e.g. Iridium) does not really arise unless you are making ocean passages. But on an ocean going yacht they can be valuable resources, even as close as West Coasts of Ireland or Scotland. Some more detal is available under the ‘Ocean’ tab on my weather website.
– Often we need local actual weather. For example you might say in your Log “we decided not to cross the Channel because the waves at Channel Light Vessel were more than 2 metres”. I have put together a south coast weather picture on my website and it can easily be adapted for other areas. Help yourself!
No Log is complete without a chart showing the track we took. In the early days, I photocopied and scanned bits of chart and then drew lines showing the track with whatever software I could find. In those days, I used the Autoroute maps. Then I got the chart images into PowerPoint so I could draw the tracklines on more elegantly with some limited animation for presentations. Eventually I graduated on to electronic charts.
How you save the data about your tracks depends on the navigation equipment on your boat. We do not need to be too precise with the track, but it should be sufficiently detailed to show the important features. The main alternatives are
(a) Track recording
Some systems will record a lot of data so you can produce a chart image with the actual track alreadydrawn on it. I have used the Australian Software On Board (SOB) system that records course; speed (SOG and boat speed); true and apparent wind; depth and other features. It is basically excellent, but as you will see from the tutorial videos, even this system has its limitations.
(b) Track display chart plotter
I am currently using a Raymarine chart plotter with Navionics software. While it may be possible to extract the chart data I have not done so. I find that it is adequate to save each day’s track so I can display it later. I am also taking a photograph of the display at the end of each day showing the track. For this purpose, the wide angle lens on my iPad camera works well. As an aside, photos of the chart plotter with AIS data displayed can also be interesting
(c) Deck Log
When we were sailing, it was a strict discipline on a longer passage to record position (lat and long), course and speed each hour. We rarely plotted the position on a paper chart, but knew we could do so with the information no more than 1 hour old. On our motor boat I record position less regularly, and I find that it it easier to place the cursor on the plotter over some significant landmark or buoy and note distance and bearing. From this data. you could reconstruct the track on a chart. I keep the deck Log if only as a protection against human error (forgot to turn the plotter on; or forgot to save the track)
Using one of these methods, it is possible to construct a chart showing the track for use in a Log. The important point is that you will probably be doing this weeks, or months, later. The three methods above allow you to do this.
Some electronic chart systems, such as Software on Board (SOB) operate on a laptop or other computer. Most of us however, use on board plotters with software such as Navionics. Usually there is an associated software package that will run on a PC. In the case of Navionics this is called PC Planner, which is what I currently use.
The basic steps required to create a chart of a cruise are
– Find (or create) a chart covering the cruising area you wish to display. This could be for 1 day, or for the whole cruise
– Draw the track on the chart
. The procedures for this, and links to video tutorials are under the Preparation tab on the left.
Provided you have adopted one (ormore) of the trhee steps above, you will have collected the material you need during the cruise for processing when you get home.
OTHER DATA SOURCES
New sources of digital information appear all the time. Among some of the recent candidates, here are some suggestions
1: Google Maps as an alternative to charts (e.g. for a land expedition)
2: Google Earth
(a) Street View ‘screen grabs’ to supplement gaps in your own pictures
(b) Street View panning shots and even driving along a road using screen capture software such as Movavi (see example on right)
(c) Map view grabbed from an altitude to simulate an aerial shot, either as a single image, or as a simulated flight using Movavi (or similar)
3: Copies of photos embedded in electronic charts such as C-Map as implemented by SOB (Software On Board)
4: Image scanned from Newspapers (especially weather maps) or Pilot Books (especially books out of print)
5: Some chart software (e.g. Nobeltec) offer 3-d views of the seabed with an exaggerated vertical scale. In the right circumstances, this can offer a dramatic illustration.
6: Data gathered by the chart plotter. For example, track recording using SOB (Software On Board) creates a database of true and apparent wind speed, boat speed, SOG, COG, depth and other parameters. These can be accessed in Microsoft Excel, and plotted using all the power of Excel. This can be useful in illustrating sudden changes of depth, or windspeed , or direction. You never know when it will be useful, but as you will probably need to record the track anyway to put on your charts the data is there, and just needs digging out. For more detail see the Charts section.
This video of the Portsall Passage illustrates a few techniques.
If you have collected leaflets or brochures; or articles and weather maps from a local newspaper, you will need to digitise them. I tend to do this only when I need to, because I have usually collected too much material! For example, when in France, I keep the weather page from the Ouest France newspaper nearly every day, but I will probably only use 3 or 4 of them in the final Log. Here is an example.
Many photo shops can scan images for you if you do not have a scanner.
I use the free Faststone image viewer. It is great for a quick look at your pictures either individually or as a slideshow.
It also has some very useful batch facilities not always found in other software. In particular, resizing images is important to stop your files getting too big. For example there is no point in images for a video being more than about 1600 pixels wide, and pictures in a text Log will rarely be more than 10 cm, One feature I have not seen elsewhere (except in Nikon NX2 software) is the ability to batch rename files. For example I run two cameras, and sometimes borrow images from other people. There is a risk that images could have the same filename. So I add a suffix to all my images. It might be my initials, my camera designation (e.g. D51 for my Nikon D5100 camera), or the name of the person whose image I have borrowed.
 At the most basic level, Faststone, or the software that came with your camera will do many of the picture editing tasks. So that costs you nothing. But for more elegant images, you will need something more sophisticated. There are numerous alternatives. At the top of the range, if you cut most professional photographers in half you will find the word “Photoshop” or “Lightroom” written through them like a stick of rock. BUT it used to be expensive, and is now only available on a monthly subscr iption starting at about £15 a month. For years I have been using Serif products, especially Serif PhotoPlus. It can do many of the things we need, though it has now been superceded by Serif Affinity which can be bought for about £50 as a one off cost. For more details about Affinity go the media tab on the home page and select “Affinity”.
Serif Affinity has many modern features, such as a better raw processing engine, and works better for tasks such as haze removal and complex selections. But if that is a bit much for you, Serif PhotoPlus is still available as a legacy product at about £20 (or less on eBay or Amazon). Support is limited, but the tutorial videos are excellent. I am using Affinity and will assert that it can do almost anything that Photoshop can do. No doubt there are other solutions. No doubt there are many 0ther products available, but I hope I have indicated how wide the range of options can be. All the quality producers of software produce excellent official tutorials, and there are often many more on You Tube or Vimeo by enthusiasts. I have found the lecture series by Simon Foster very useful (and affordable) I promise I have no commercial connection!
If you are looking at other software, make sure that (a) you can draw lines on the image (b) select areas of the image for correction (c) mask areas of the image and (d)control the opacity of a layer. The video above gives a very basic introduction to these essential concepts.
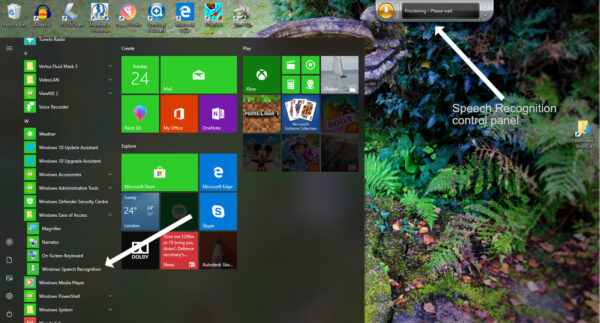
I hate typing, and modern computers are getting better at speech recognition. Currently, I am using the Speech Recognition on my Windows 10 machine that you will find hidden under “ease of access” -so it is already there, another freebie. I use it to prepare scripts for videos, which can then be used in the text Logs.
It takes a bit of time to set up, and works best with a digital microphone on a headset (or a professional microphone setup). But once set up, it makes life a lot easier. Well worth the effort.
(Only required for video Logs). For a couple of years I have been using Audacity which is open source, and therefore free. It is quite adequate for recording for a video Log.
Good quality recording of sound is vital for a good video, and it can be the most difficult part of the process. I had progressed to a digital USB microphone on a headset. The quality of the sound recording on my video editor was not good enough (which is why I installed Audacity).
So often it is the quality of the sound that lets down a home video. I was still not satisfied, and eventually bit the bullet and bought a Yeti Silver microphone and a supporting arm. I had tried various recording software solutions built into video editors, but they did not seem to deliver the right compromise between quality and simplicity. So mu current solution is the Yeti microphone connected by USB to Audacity.
If you have Word or similar that will probably do the job. However, I find it easier to use a desktop publisher. Until recently I used Serif PagePlus. This has now been declared a legacy product, so will soon become obsolete, but it can therefore be bought at the very low price of £20. As a replacement, Serif launched their new Affinity Publisher program in Beta form just in time for me to use it for my 2018 Log. It is wonderfully easy to use, and will eventually integrate completely with the other Affinity products (Photo and Designer). It is very easy to use and get good results. But like all power products, it takes a little time to understand the subtleties. I am thoroughly enjoying the process of learning. Judge for yourself – the finished 2018 text Log produced in Affinity Publisher can be seen by clicking here and selecting 2018. The text Log is then accessible under the pdf/pages tab.
Only required if you want to produce a video Log).
(a( VIDEO EDITOR
If you are not familiar with video editing, there are some concepts that need to be grasped. The very basic ideas are well set out in this starter video by Cyberlink. Other editors that use a timeline will look different, but have broadly similar features.
There are other concepts, probably the most important, but difficult to grasp, is the idea of ‘keyframes’ Here is another video that explains the concept.
https://www.youtube.com/watch?v=uT_cnFfEubw&feature=youtu.be
For a decade I have been using Serif MoviePlus as my video editor, but Serif have decided to focus on their Affinity range (which I think is a world beater) and they have withdrawn MoviePlus (though it can still be bought cheaply on eBay and will do a good job). So I was forced to look around. It is a wide field, and I do not yet know whether I have made the right choice. All I can say is that my early experience with Cyberlink Power Director has been generally positive (I managed to find a relatively cheap deal, I think it was about £50), though I miss a few features of MoviePlus.
In the Autumn of 2018, I lost a month checking out other video editors. A good friend who was a professional video editor with a TV company suggested I should look at Avid. It is little short of brilliant in its power, but requires more processing power than most hobbyists want to deploy. I have a high end Dell laptop, and it could not support Avid, so I abandoned it, reluctantly. Then I was pointed at Da Vinci Resolve, where there is a good free version. Again, excellent. However, the free version includes a very limited range of presets (for example, transitions). That is not a technical problem because the fusion element of the program offers an elegant way to resolve that. But, once again, the computer power required proved too much for my Laptop. So it was back to Cyberlink Power Director. At one point they launched a subscription model, and I thought I was going to be shut out by that (subscription models are only beneficial to professionals). However, for the moment, they seem committed to supporting both subscription and buy-outright models. The suite offers a useful range of presets such as the new collage capability, though that gets close to crashing my computer. Such powerful features are best treated as a separate clip, which is not much of a hardship.
 Increasingly I am starting to use mobile platforms such as iPad Pro. Maybe I can leave my laptop ashore? But to do so, I need some video editing capability. After looking around, I have opted for Luma Fusion. At under £20, it seems like a worthwhile risk. It has the types of capability I am looking for, including the ability to process multiple tracks. We shall see whether it works!! It means I can record simple clips such as weather forecast sequences from sites such as ventusky and process them for inclusion in video Logs.
(b) VIDEO PLAYBACK
In the early days I used Windows Media Player for playback of video clips. However, there was a problem using it on Windows 8, probably solved by now. I took advice and settled on VLC Media Player 64 bit. It is free and works well.
(Warning! Some of the download sites will try and lumber you with unwanted search bars. Make sure to say ‘NO’ to all additional software offers when downloading)
Sometimes it is desirable to copy what you can see on your PC screen (which is how I make the tutorials, for example). It is a bit of a luxury, but nice to have. I am currently using Movavi Screen Capture.
 I am coming round to the view that it may be useful to record weather forecast sequences from sites such as Ventusky. As I am hoping to rely increasingly on my iPad Pro when I am away on a cruise, I need an app that would work on the iPad. Incredibly, I have found an app called “Record it!” which seems to work incredibly well. What is more, it is free.
 Here are some simple housekeeping rules that make it easier to keep track of all the information that accumulates round a Log.
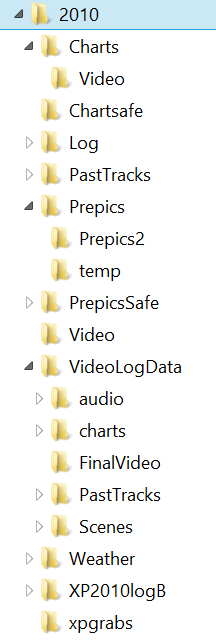
I download all pictures from the camera using the Nikon software that was provided with the camera. Then I copy the images to a working directory from which various copies can be made for various purposes. The directory structure I used in 2010 gives some idea of how complex this can become. But it is the only way to find the image you want.
As soon as possible I transfer the pictures to an Archive, which is grouped by date within years (I am now using Elements Organiser). If I borrow pictures from other people, I batch rename them (using FastStone), adding the persons name to the end of the filename to eliminate the risk of filename duplication.
If I generate weather maps, or other screengrabs, I keep these in separate directories, usually starting the filename with a date in the format YYMMDD.
All the above items maintain a basic time related data sequence which makes things easier to find
I create a working directory (or directory set) for each application, such as Narrative for text Log, DVD/Movie, Presentation. In these directories I place copies of the pictures with a literal name added at the end. For example a picture might be IM0008200FourLight, and a weathermap might be20090811ECMWF, and a chart might be just SolentAlderneyTrack. I may resize these images in batches to keep the filesizes smaller. This can be quite important when preparing Movies (1080 pixels wide), PDFs (usually I resize to 4 inches width, Powerpoint presentations (900 pixels wide), and Web pages (tiny images on page, larger enlargements, or 800 pixels wide if using a lightbox)
This is the most important and most challenging task of all. Showing where we went is one of the key features of a Log.
Just copying bits of charts and drawing the track line does not work too well – too much detail is lost. Assembling the tiles you copy into panoramas is complex, so I have prepared a series of video tutorials covering different types of track. Here is an introductory video for the series.
The demonstration videos are set out below
(a) Producing a track chart for a long passage
In this demonstration we look at the situation where you are looking further ahead at the weather, possibly because you need to make a major decision. For example you might be in the Scilles, and wondering whether to go north to Ireland or south to Brittany.
In any case, I like to take a long look ahead at the weather about once a week when I’m away on a cruise, and occasionally it is nice to include this in the Log. My preference is to use the Met Office synoptic chart for this purpose. Sometimes I choose the colour version, and on others I think the black and white version has a more official feel. It is one of the few charts that shows the position of the fronts and we know it has been looked at by a professional forecaster and not just spewed out of a computer model.
This video starts by constructing a chart with sufficient detail by stitching together a series of tiles. The track is drawn on this base. The result is a track that can be used in text Logs. The demonstration is in three parfts
Part 1
Part 2
Part 3
(b) Simple chart (e.g. a local passage)
If no tiling is needed to bring out chart detail everything is much simpler. In this video, it is also assumed that you only have a photograph of the track on your plotter, so have to draw the track by eye.
(c) Tracks on land maps
This video illustrates how certain forms of land map, such as Google Earth, can be exploited to produce a track chart. The first illustration is straightforward, while the second makes use of Google street view to find a minor track road. To exploit this requires a tiling technique.
(d) Animation of a marine track for a video
If you are wanting to produce a video, it is fun to be able to animate the track. This video explains the techniques for doing this for a sea passage
(e) Advanced technique for an animated land track
The same techniques can be used to produce an animated track for a journey on land or sea. However, I recently discovered an easier way to achieve the result which works well on land, especially where the road has a lot of wiggles. The procedure depends on being able to draw lines within the video editor, which my new editor can do (Cyberlink Power Director). There are possible workarounds, but I have not tested them. I also think it would be tricky, but not impossible, to develop this technique for marine tracks, and I hope to publish a video on this when I have worked out the detail procedures.
All our cruising takes place in the context the weather. It can dictate where and when we go, and affect our mood. It therefore provides a wonderful background to a Log. Over the years I have put together a set of weather websites that I found useful sailing on the South Coast and the coasts of Ireland and France. They can all be accessed from my website at https://mvteal.co.uk/weather/ .
Apart from the useful overview, 4 days ahead, given by the Windfinder app, it is divided into these sections
(a ) Synoptic charts and official weather forecasts
(b) Current wind and wave conditions at useful places
(c) Tidal data
(d) Other useful sites
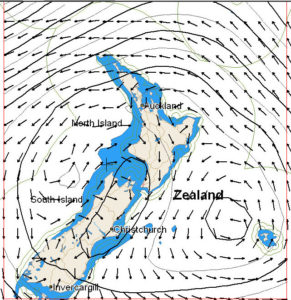 Grib files are an incredibly efficient way of downloading and saving weather data for future use in your Log (including wave and swell patterns). For example, when we were cruising with our son in New Zealand over Christmas in 2011, we were able to download weather maps like the one on the right. We opted to include only wind and pressure data. On this basis seven daily forecast maps for week ahead required only 23 kilobytes, using a service available from Mailasail. The service can be accessed by single side band radio, satellite phone, or on the Internet. The small file size makes for efficient transmission, and low call charges.
While in New Zealand, the grib files were displayed on our Software on Board chart plotter system. Most modern multifunction chart plotters have the capability to overlay weather Grib files on the chart. However, I prefer to use an independent grib reader. The one recommended by Frank Singleton (my weather guru) is Zygrib. It is available free on Windows machines. (On my tablet I am using Gribview, though some functions, such as wave data, attract a charge. Generally I prefer to download data to my windows computer, and mail it to myself if I need to see it on the iPad)
Here is a simple demonstration of how to extract images for use in your Log using the same grib file as the example above.
Here is a video about making the most of the flexibility of zygrib files and extracting the information for use in Logs.
It also covers the technique for copying and using any screen image in your Log. So you can copy any of the weather maps or forecasts shown on my weather site and save them for use in your Log later.
The weather page on my website also includes comment on other aspects of weather data including links to an explanation of GMDSS. It sounds boring, but it is important.
Occasionally, it will be desirable to take a longer look ahead at the weather. There are some helpful techniques for assembling such information which are described in this video
There are 3 parts to this section
- (a) Image processing
- (b) Cheating!
- (c) Panoramas
(a) IMAGE PROCESSING
Whole books are written about this, and there are now many good tutorials available on You Tube, Vimeo and elsewhere. All I can do is express my personal choices. The most important thing is to use the photo processor with which you feel comfortable, and which delivers what you need. For years, I have used Serif PhotoPlus, and improved my skills as the product has evolved. But when I started shooting raw images, I was advised to switch to Photoshop Elements. It was a successful move and I am still using the Organiser to store and catalogue my photos, now numbering more than 10,000.
More recently I have switched to using Serif’s new flagship products – Affinity Photo and Affinity Designer. I think this is a world beating piece of software and it is not expensive. (There is more discussion of Affinity under the media tab at the top of this page)
Affinity Photo and Designer are available for Windows and Apple Mac computers, and there is a fully featured version available on high end versions of iPad Pro. All files are interchangeable between platforms.
Affinity Publisher came out in Beta form in time for me to use it for my 2018 text Log, but the Data Asset Manager is still further down the pipeline. That is a pity because Photoshop Organiser will not accept Affinity files, which I have to keep separately. This is causing some chaos!
Whichever image processor you choose to use, there are some basic steps that need to be observed. These are well described in the ‘taster’ video by Simon Foster for one of his courses on Udemy. The courses are good value, and I have found them very helpful in improving my photo processing skills.
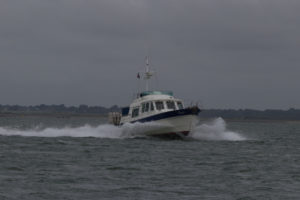
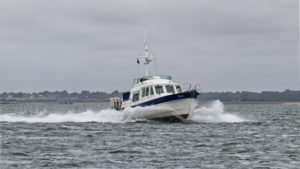
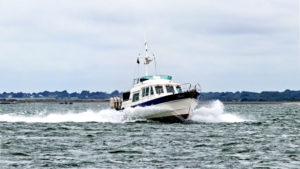
Here is another static example. This sequence is based on a photo of my boat Teal taken by a friend, who was sailing his own boat single handed on a grey say in the Solent – far from ideal circumstances,
This is the photo as shot. The original was in RAW format, so it has been given minimum processing to generate a jpeg that can be uploaded..
.
.
Step 1 Rotate and Crop
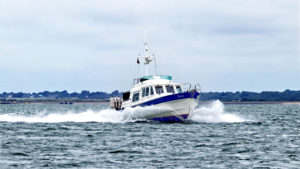
The human eye will pick out a slanted horizon, even if the angle is only 1 or 2 degrees (You can get away with a slope of 20 degrees if it is there to produce a special effect!). So step 1 is to straighten the horizon and crop the picture to bring out the subject.
At this stage, it can be useful to change the aspect ratio to 16:9 which is probably the most likely screen ratio to be used. However, the minimum crop should be used because you do not know at this point how the image will be used. It could be just a picture, or an inset on a chart, or even part of a panorama. So it will be cropped and reshaped again later.
Step 2: Light and Dark
This is done using standard tools such as Brightness, Contrast, Saturation, Lightness, and a common but powerful tool called levels. These are commonly called adjustments and in the best image editors, each adjustment has its own layer, so you can go back and tweak things till you get things right,
Step 3: Adjust Colour.
This can be where things start to get tr icky. In the case of this photo, the camera did not pick up much colour on the grey day. Only a powerful image editor such as Affinity Photo or Photoshop/Lightroom (and some others) have the ability to select an area to recolour. (Selection and masking an area are discussed later). In this case, a rather tricky selective colour adjustment was needed to pull out the blue in the Hardy stripe along the hull. A little green was added to the shoreline vegetation There was a little white balance, and a slight tint was put into the see, using a layer mask (consult your software supplier to learn about such features. Here I can only deal with the sequence).
Step 4: Sharpen and reduce noise
Most digital images require sharpening, but there can be a price to pay. Sharpening can increase ,noise (that nasty speckled effect you can get, especially with images taken in poor light or at high ISO values); over-sharpening can cause a colour fringe round edges; and an oversharpened image looks terrible. I like to reduce the noise first (your software tutorials will show you how), but you cannot overdo that because you will lose detail in the image. So sharpening and noise reduction go together and the best combination only comes with practice.
There are several ways of sharpening. Using widely accepted industry terms, the most common is called, strangely, “unsharp mask”. You can control the “radius” or width of the sharpened edge and the severity, commonly called “range” or “Factor”. There is often another adjustment called “clarity”. This increases the clarity in the mid tones. I use it a lot in landscapes, but beware of using it if the main feature of a photo is faces. It can bring our all the wrinkles and spots! My favourie methos is known as “High Pass filter”. This uses blend modes, a common feature in digital photography, but explaining itis beyond the scope of this note. However, it is a technique well worth researching in your image processing software.
Also, remember that different parts of the photograph require different types of sharpening. In this exampke, clarity was used for the overall scene. Then the water was sharpened using a high pass filter. For the boat itself I used two further techniques that only work on some type of objects, including engineered objects such as the boat or strongly defined features such as rocks or buildings. Firstly I applied some “tone mapping”, a technique usually associated with HDR (“High Dynamic Range”) photography. Overdone, it can look dreadful, but if applied to a duplicated layer, then softened by reducing opacity, it can add punch. There are also numerous techniques to make an image ‘pop’. I like one suggested by Affinity in which an extreme unsharp mask is applied with a “lighten” blend mode. This has the effect of bringing out and brightening edges in an otherwise dull area.
5: Corrections
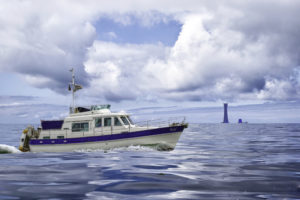
In his video (above) Simon Foster defines corrections as actions such as removing spote and blemishes, red-eye correction, and he mention removing ‘unwanted’ objects from the image. But there is another type of correction. It happens when we want to include a picture of our boat but there was no one there to take it – it is very difficult to get good images of your boat at sea. So we have to use another picture taken at a different time and place, with different weather, sea conditions, and background (coast, or open sea). We have to CHEAT!. This is discussed in a separate section below. In the meantime, here is an image that I used in my 2018 Log. The only genuine part is the improbable looking sea. It really was like that. The sky, and the lighthouse have been added, and the picture of Teal was taken on the same grey day as our sample image, which is rebuilt in the next section.
b) CHEATING!
The key to cheating is selection. Every good image editor will have extensive tutorials on this subject, and there are a variety of tools that can be used. What I describe here is based on Affinity Photo, but can apply in most cases to Photoshop, Lightroom and Elements and no doubt others too. Boats are a special case because the rigging is fine, often with little contrast to the sails or sky behind. So fast selection processes such as flood fill, or colour selection do not work well. A “refine” process which is used for jumbled areas such an untidy hair or leaves on trees can work, but not on a boat;s rig and sails. However, the technique for enhancingthe contrast whiule selecting as described in the video below can be helpful.
I am still developing my technique for dealing with masts and sails, but I have found the following steps are quite good.
- make sure the horizon is very straight
- use the rectangular marquee to remove sky above a clear horizon
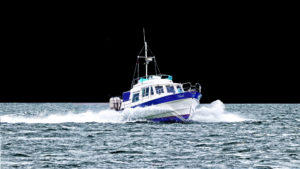
- use a “quick select” process which produces a colour wash over the image so you can paint in the bits you want to keep. You have to zoom in so close that you can see the individual pixels. It is slow, but worth it to create a good template that you can used several times with different skies or backgrounds.
- touch up any missing lines by adding straight lines to the image after cutting out.
In the example here, I have added a black background to highlight the rig,
The final step is to find a sky image that matches the weather on the day you want to portray. It is then pasted into your cutout image, resized or stretched till it fills the sky, then moved behind the layers so that it acts as a background. Commonly the sky and sea colours will not blend well, so it may be neccessary to adjust one or the other. Typically changing the saturation and/or hue with an HSL adjustment will do the trick. However, the adjustment must be applied to the right layer (e.g. sky or sea or boat) Typically this selection will be done using a layer mask. This important technique is described in numerous tutorials.
Some of the techniques referred to may seem obscure. This link (click here) takes you to a useful independent listing of the official Affinity tutorials that I use regularly. Go to the Selections and Masking Group if you want to know more.
Recently I have developed my own procedure for getting the best out of a picture that may have been taken in less than ideal conditions, and then applying a sequential process for getting the best selection. This is an advanced technique, not for the faint hearted!.
The enhancement and selection technique is demonstrated in this video
eal.
This video is about using a photo taken by a friend, taken from a moving platform(another boat) under less than ideal weather conditions. We take the image and transform it so it can be used in an entirely different context.
I have used three techniques described in official Serif Affinity videos by James Ritson. They are
“Bringing Out Water Detail” https://vimeo.com/202899215
“HDR from one exposure” https://www.youtube.com/watch?v=Ar6CZvfyFvk&feature=youtu.be
“Making Images Pop” https://vimeo.com/178575803
The first part of the video deals with enhancing the basic image, including two different applications of tone mapping.
The second part deals with four different approaches to selection, to deal with different aspects of the image and how to combine them.
I have not seen the use of the pen tool to create fine detail precise selections before, but maybe I did not look far enough. So far as I know, it is a first.
The same problems apply to a lot of outdoor activities including windsurfing, climbing, motocross, horse riding. Wherever there is equipment, wild background, fine details (such as reins or ropes) then complex selection may be needed so you can blag an exciting picture.
.(c) PANORAMAS
Sailing is essentially “panoramic” – we like “wide horizons” These images can be used as banners at the head of a page, converted to video ‘pan’ shots (much steadier than panning hand held from a boat), or just inserted into the body of a text Log
There are two basic ways to create a panorama
– Crop a panoramic image from a standard photo. This requires a fairly high resolution image to start from
– Join a series of carefully overlapped images using ‘stitching software . There are standalone panorama stitching programs, but in recent years, the capability has been integrated into the better photo processing packages.
Long thin panoramas can be used to create a video pan shot using software such as Cyberlink Power Director
The option of taking a burst of photos while panning only works if high shutter speeds are available. A more considered approach taking carefully overlapped images is better. BUT be sure to lock aperture and shutter speed
Once you have the set of images, the process of stitching them together may vary a little from one photo editing program to another, but here are the steps using Affinity Photo.
Storyboard
We already have our “storyboard” – The Deck Log (see the source material tab). Each day will become a ‘scene’ in the video. Clips can be assembled for the weather, and the track.
My usual practice is look at the Deck Log page, then open the video editor. I can add labelled blank pages for the weather, and track clips which can be substituted by video clips later, then put together a string of still images taken that day. That should be enough to provide prompts for the script or commentary.
Commentary (Script)
With the storyboard and Deck Log in front of me, I can dictate the script using the computer’s voice recognition. Normally I produce a separate script document for each day (or ‘scene’). At first this process can be frustrating because the voice recognition software will not recognise many nautical and navigational terms; or the strange place names if your cruise has taken you abroad. It is worth persisting, going through the process of teaching the computer these new words. The detail can be edited later using any word processor.
This commentary is going to get cut into chunks that match the video. So it is wise to avoid long sentences, especially linking two parts with “and” or “but”.
The corrected document then becomes both the script for the video and the first draft text for the text Log. (As an aside, I usually find that bits have to be left out of the video commentary to make it flow. I do not delete them from the script.I just use strike-through. Then, when it comes to the text Log, where there is more flexibility, they are still there).
Soundtrack
The soundtrack will make or break a video. Nothing else has caused me more problems! There are three key factors
- The best microphone you can afford (I am now using a Yeti silver, mounted on an audio pantograph with a ‘pop’ filter). With cheaper microphones, you may get a background hiss, and even with the best software, the quality of the recording is degraded with hiss removal)
- Audio software that is clear of background noise, and is easy to control (I now use Audacity for most things, only occasionally making use of the audio software built into my video editor)
- Careful balancing of commentary, music and any sound effects. Most TV programmes have the music far too loud – it is an easy mistake to make.
OK! I have been making videos for more than 10 years and this is where I am now. I have gone back and re-recorded soundtracks, but most of my earlier videos I am content to leave, even though they could be improved. As a minimum, I would recommend (a) a USB microphone (b) use Audacity software (which is free) rather than the audio software built in to your video editor.
Unless you are a professional sound engineer, it is important to record each scene is conditions as close as possible to all the other scenes. Record in th same room. If it has curtains, they should always be closed or always be open; try to speak at the same distance from the microphone every time, etc. Of course there needs to be ‘colour’ in commentary – excitement or anger, or concern, but it is best if the volume level is fairly constant – I have a bad habit of letting my voice drop at the end of sentences. With the Yeti microphone, best results are by speaking close to it, but the pop filter is essential to avoid sibilant “s” sounds, popping “p” sounds. It makes a huge difference!
When recording, you may be a bit tense. This makes some people speak faster. Resist the temptation. A steady pace with clear enunciation is best. Remember, in the final video there may be other sounds as well. Also, avoid the dreadful football commentary fashion of shouting with a strangled scream to indicate excitement. Instead, try to emulate the great Peter Allison commentating on golf. He managed to convey excitement without raising his voice by more than a notch.
If you fluff a word when recording, pause for a second or two, then re-record the sentence. It is very easy to delete the faulty part, but far more difficult to insert a patch with identical recording conditions. While splicing in a new piece later can be done, I often change the script and re-record the whole day if there is a need to change the script.
Here is a video in which I illustrate some of the points made about creating a soundtrack
Editing guidelines
Most video editors operate on a ‘layers’ basis. The layers at the top of the stack are shown on top of those below (The commentary and music layers are, of course different). What is shown here is the set of layers I usually find most useful. It is a flexible set. Sometimes there will be more layers, and in other cases fewer. In particular, if you want to produce a shot that contains several images (e.g. 4 images on screen at once in each quadrant) then more layers will be needed. Experience suggests that when you want to do this it is best to make a new, separate file as a video clip that can be incorporated into the main video on a single layer. This is especially true when making use of facilities built into the video editor, such as the extremely useful ‘collage’ routine in Cyberlink Power Director. It works well, but avoids complexities and crashes if it is used to create a separate video clip.
Each video track will normally have an audio track associated with it. As our video is mainly assembled from stills with transitions or zoom/crop effects, these audio tracks will not be needed except where a real video clip is inserted. I normally minimise such audio tacks but leave them in place until I am sure they are not needed. a video ifEven when you have taken video, the sound is generally useless because of wind noise (I do not have a wind protected microphone). I usually add a sound effects track instead. For example I found a clip of Perkins Sabres the same size as mine running at 1500rpm. It is easy by adjusting the clip length to change the sound to 1600 ir even 2500 rpm. I also make the sound a lot quieter than reality!
Modern video editors are full of all kinds of gee-whizz effects and transitions. Use too many, and your video will be over-complicated. In my 2018 video I used two transitions – fade (between clips) and a 3d-roll (between scenes (days)). I think there may be one or two exceptions used for special effect. Effects such as changing brightness or contrast were mainly used to correct defects. Keep it simple! (If possible!)
WE are making the Log oif a holiday cruise, not a Hollywood blockbuster. We did not have several cameras, a chase boat; most of the images will be stills, with a few video clips interspersed. That means we will have to make the stills look like video buy using fade, zoom and crop operations, coupled with multi image collages. It is almost certain that there will be gaps when we forgot to take a photo, or it was so badly out of focus it cannot be used. Google Earth, travel brochures, and local newspapers then become our friend. As you go through the edit process you will find the need to resort to these sources to maintain the continuity of the story. That is why we collected all those brochures and newspaper cuttings.
Editing a scene
Each scene stands on its own, but in the end, they have to be linked together. I prefer to start with the scene after the opening titles and credits, then do the opening Titles scene before continuing with the remaining scenes. So lets start with the scene after the opening titles and credits.
There should already be a timeline as described in the storyboard section above. By default it should be on the Main Video/Still track.
There will be a transition from the previous scene. The easiest thing is to allow about 5 seconds of a relevant still to allow room for the transition (it can be shortened later if needed). In a Log it will probably be necessary to add a title at the beginning of each scene, typically a date. In my 2018 video I put a scroll on the overlay track and the date on Text 1, both fading in and out over 5 seconds.
For a Log, the continuity is provided by the track video clip, which goes on the Track track (at the bottom of the video stack). This will be behind everything so will be obscured if anything is on any higher track, unless (a) the higher track is cropped to part of the screen or (b) the opacity of the higher track is reduced so the Track shows through. Typically the track video for a day will last about 30 seconds, which is not enough for the day’s video. So it will have to be split (and maybe stretched or compressed. Video editors may try to stop you stretching a clip because this would have weird effects on any associated soundtrack. Normally this constraint can be switched off, as most of our clips, including the track, will not have a useful sound track attached to them.
Title and credit content here
Your Content Goes Here
Add music content here
Your Content Goes Here
I am now using Affinity Publisher to assemble my Logs. Here is a video on how to set up the Log template
Text Prep content here
add images and captions content
track charts and weather content
Covers content
print and publish content
Your Content Goes Here

